Monitoring of the physical labs
Table of contents
Monitoring of physical labs is included among the key feature of the more general Digital Twin architecture, as discussed in the article by Modoni et al. [1].
An effective monitoring asks for 1) predefined schema to formalize data that are exchanged and 2) a communication channel. The following sections address these two requirements and present the solution developed for Virtual Labs.
Formalization of monitoring data
During monitoring, the states and properties of assets evolve along time. Unfortunately, the data formalization adopted for defining assets of a physical lab is not appropriate, since the properties are static. Therefore, herein another data schema is used to capture the evolution of monitoring data while keeping consistency with the schema defining the assets.
The proposed schema can be used to serialize data in JSON files that are produced/consumed by software applications related to the virtual lab. The same schema can be used to formalize the evolution of assets related to historical data or simulated data. In same cases, the raw message can be serialized according to a different schema, thus needing a preliminary elaboration and conversion (e.g. example in Sect.4).
The JSON schema is composed of three root properties:
-
“context”: set of properties of initial setup
-
“nodes”: an array defining what happens during the asset evolution
-
“sequences”: an array defining sequences of asset animation (mainly space&time)
The “context” is characterized by the following property:
- “UnitOfMeasureScale”: (optional) unit of measure scale (e.g. 0.01 stands for centimeter, whereas 1 stands for meter). If not defined, then the unit of measure of the associated scene is adopted.
Each item in the “nodes” array contains the following properties (all required):
-
“id”: unique identifier of the asset that is characterized in terms of evolution [required]
-
“actions”: array of actions that are relevant for the asset evolution
Each item in the “actions” array contains the following properties (all required):
-
“trigger”: specifying when the action takes place with properties “type” and “data”
-
“event”: specifying what action takes place with properties “type” and “data”
Possible values for “type” of “trigger”:
- “timestamp”: the value in “data” is interpreted as time in milliseconds after the start of asset evolution
Possible values for “type” of “event”:
-
“animation”: the asset starts an animation. The value of “data” property defines the animation sequence to be employed, specified either as the ID of an item in the array of “sequences” or as the path of the file (.bin or .txt) containing the animation sequence as text. The positions and rotations are defined in absolute terms, but if the additional property “placementRelTo” is defined then it must be intended in relative terms.
-
“animationAdditive”: the asset starts an animation. The value of “data” property defines the animation sequence to be employed, specified either as the ID of an item in the array of “sequences” or as the path of the file (.bin or .txt) containing the animation sequence as text. The animation is intended as additive (incremental) with respect to the current placement (position, rotation) of the asset.
-
“show”: the asset is shown in the scene. The place where the asset appears is defined with additional properties (as for the scene definition): “position” (default value [0.0,0.0,0.0]), “scale” (default value [1.0,1.0,1.0]), “rotation” (default value [0.0,0.0,0.0] Euler angles YXZ in radians), “placementRelTo”. For instance, if only “placementRelTo” is defined, then position, scale and rotation have default values.
-
“attach”: the asset keeps its absolute position, rotation and scale, but its location in the scene graph is updated according to the value of property “placementRelTo”. If “placementRelTo” is empty or not defined, then the asset is attached to the root node in the scene graph.
-
“hide”: the asset is hidden from the scene
-
“state”: the asset changes its state in terms of 3D representation and description. The state is specified by the following properties, all optional:
-
“data” property is a string with the file path of the 3D representation file (e.g. .obj). The new 3D representation completely replace the (possibly) existing mesh while inheriting its attributes (e.g. position, rotation, scaling).
-
“descr” is a string with the description of the current state. This description is incremental and does not replace the static description of the asset.
-
-
“link”: link to a (text) file that is specified by the following properties:
-
“data” is a string with the local file path
-
“descr” is a string with the description of the content that is found at the link
-
“URL” is the address where the file can be downloaded from
-
Each item in the “sequences” array contains the following properties:
-
“id”: unique identifier of the animation sequence
-
“FPS”: integer defining the FPS (frame per second).
-
“pos”: [optional] array of positions in the 3D space for each frame.
-
“rot”: [optional] array of rotations (as Euler angles YXZ in radians or alternatively as quaternion for “animation” and axis-angle for “animationAdditive”) in the 3D space for each frame.
MQTT communication
An efficient and effective communication channel is fundamental for monitoring and synchronizing the physical lab and its virtual counterpart.
MQTT (Message Queuing Telemetry Transport) is a lightweight, publish-subscribe messaging protocol that is commonly used in the Internet of Things (IoT) and other applications. MQTT can be exploited for monitoring assets, but also for bi-directional communications with assets that can:
-
send feedback about current state and value of dynamic properties
-
receive commands for the execution of actions, change of setup, etc.
General MQTT architecture
Different programming languages can be used to develop MQTT clients that participate in a MQTT communication architecture, e.g. JavaScript and Pyhton libraries. In addition to publishers and subscribers, the MQTT architecture needs a broker to manage messages.
Several resources are freely available online to develop MQTT architectures:
-
tools to develop and test MQTT architecture/components (e.g. MQTTLens)
-
free public MQTT broker, e.g. broker.emqx.io
-
desktop MQTT client, e.g. MQTTX
-
tutorials on MQTT and related tools, e.g. this tutorial
-
libraries to develop MQTT components, e.g. MQTT.js library
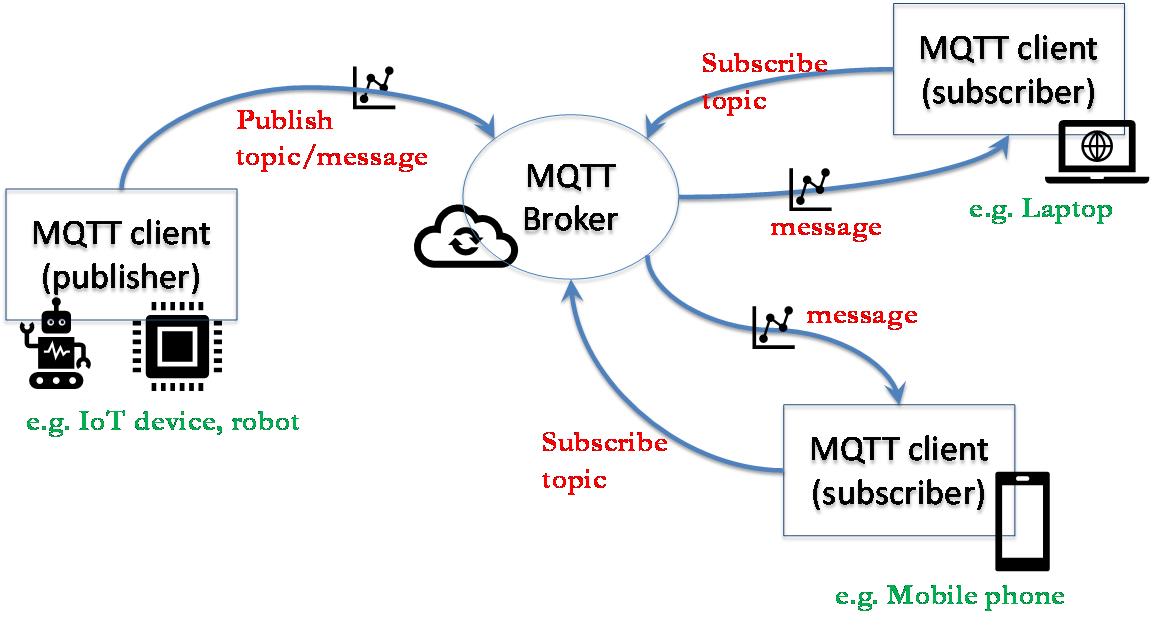
The monitoring can be realized by exploiting the MQTT architecture, as shown in the following figure.The Physical Lab (PL) plays the role of publisher and the Virtual Lab (VL) plays the role of subscriber to the PL topic.
The controller on the side of the physical lab will take care of generating the outcoming messages, while the software tools on the virtual lab side will elaborate the incoming messages.

MQTT-based architecture for monitoring
OntoGuiWeb
OntoGuiWeb is a web application providing a graphical user interface for the instantiation and exploration of digital models, in particular defined as OWL ontologies. OntoGuiWeb was first developed during previous projects and works on any browser without specific configuration of the hardware is needed. OntoGuiWeb is developed in JavaScript making use of libraries rdflib, opn, path, server, xmlhttprequest. Source code of OntoGuiWeb is available upon request for non-commercial applications.
A demo of OntoGui Web is available online and includes the following basic modules: Control Panel, Utilities, Asset Design, System Design, System Control, Performance Evaluation, Virtual Environment, StateChart, SPARQL.
During the VirLaDEE project the novel OntoGuiWeb module name MQTT Sync was designed and implemented, taking advantage of the JavaScript library MQTT.js.
The MQTT Sync module provides an MQTT client that can:
-
publish a message on a topic
-
subscribe to topics
In addition, it is possible to load a sequence of messages (“Message Sequence”) as a JSON list and publish them automatically and iteratively based on a predefined time interval (“Message interval”).
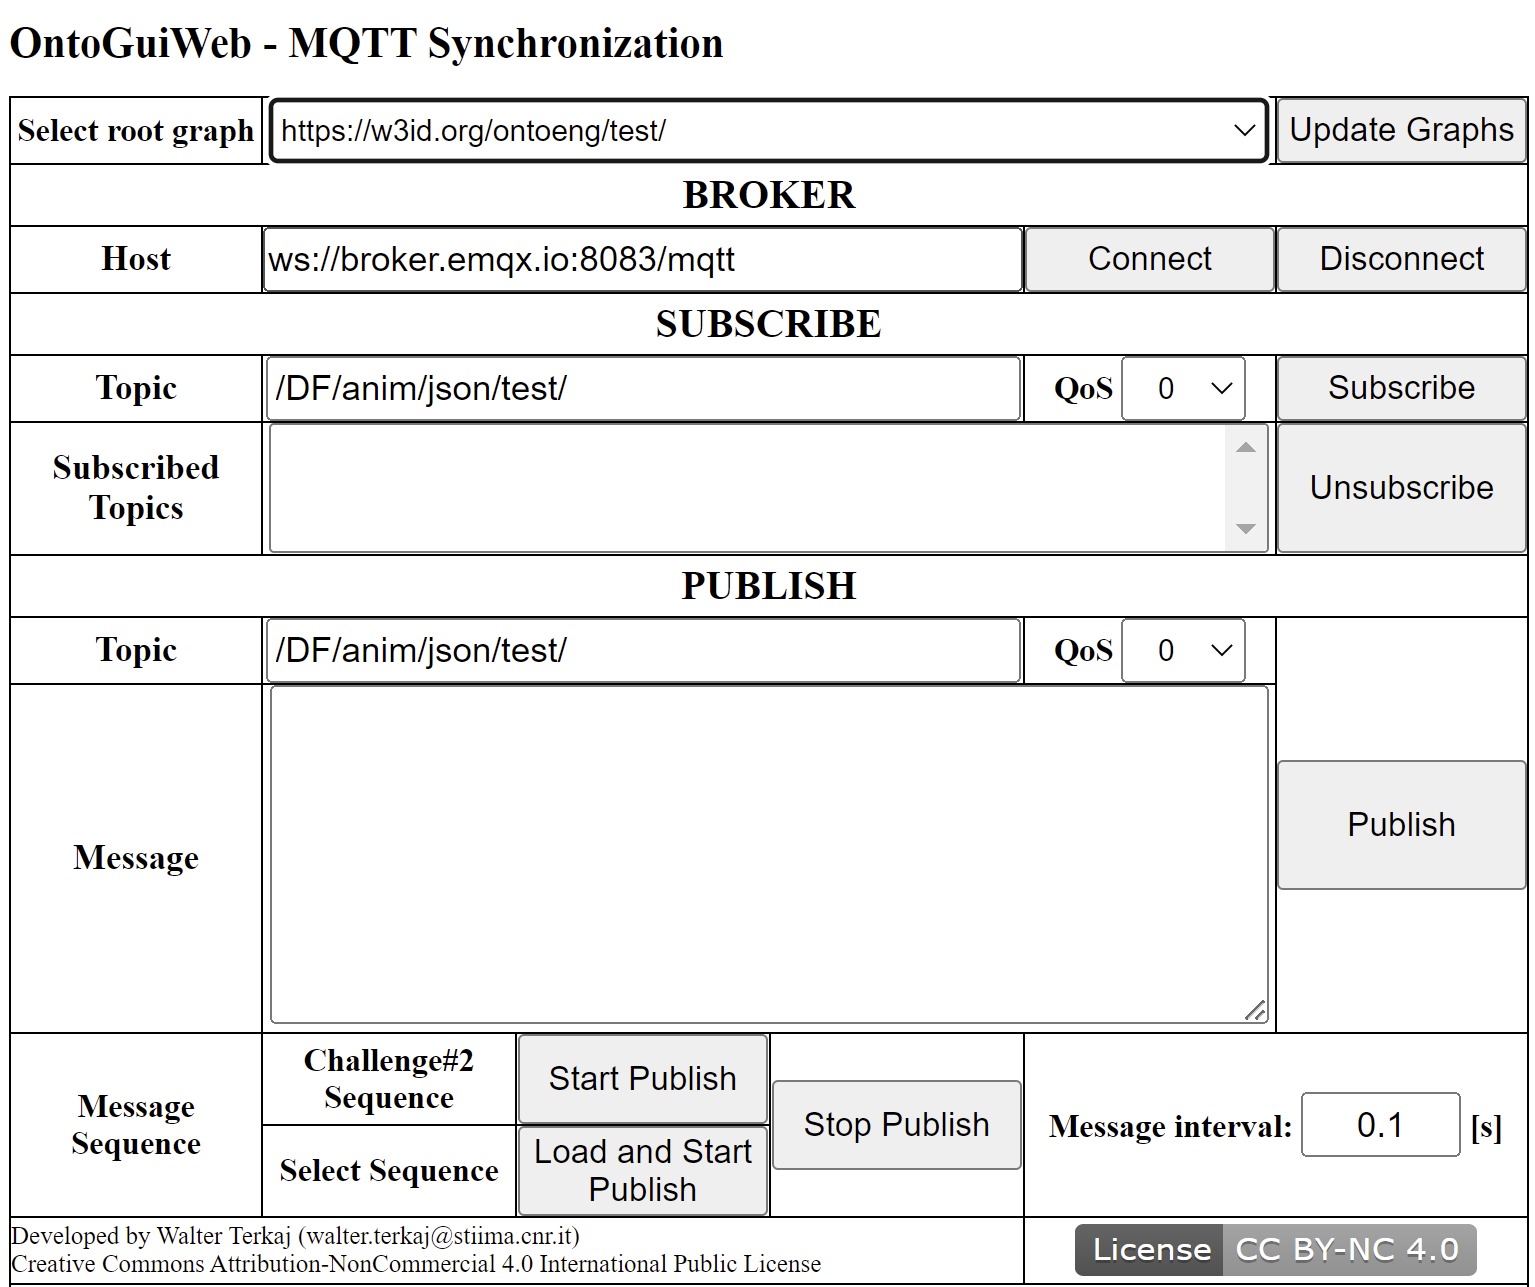
OntoGuiWeb – MQTT Synchronization module interface
An example of monitoring is provided for the PERFORM Lab use case.
References
- Modoni GE, Caldarola EG, Sacco M, Terkaj W (2019) Synchronizing physical and digital factory: benefits and technical challenges. Procedia CIRP, 79:472-477